Code
library(ggplot2)

mtcars |>
    ggplot(aes(x = wt, y = mpg)) +
    geom_point() +
    labs(title = "Miles per Gallon vs Weight")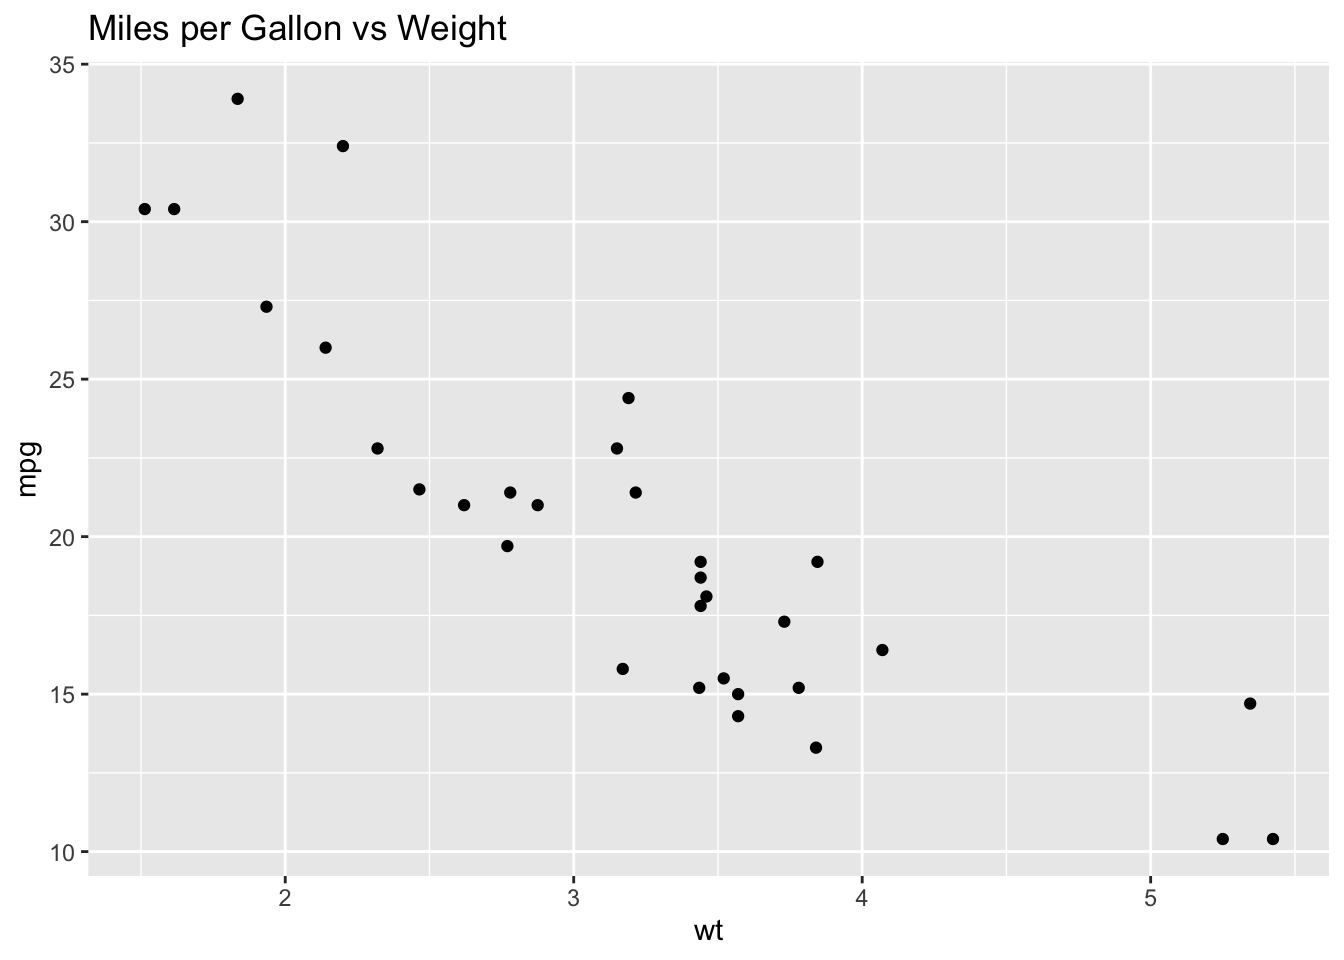
Quarto allows us to add computations from a variety of languages to our markdown-like documents.
Below is an R code block followed by its output:
library(ggplot2)
mtcars |>
ggplot(aes(x = wt, y = mpg)) +
geom_point() +
labs(title = "Miles per Gallon vs Weight")
Below is a Python code block followed by its output:
import pandas as pd
import matplotlib.pyplot as plt

mtcars = pd.read_csv("https://raw.githubusercontent.com/plotly/datasets/master/mtcars.csv")

plt.scatter(x=mtcars.wt, y=mtcars.mpg)
plt.title("Miles per Gallon vs Weight")
plt.show()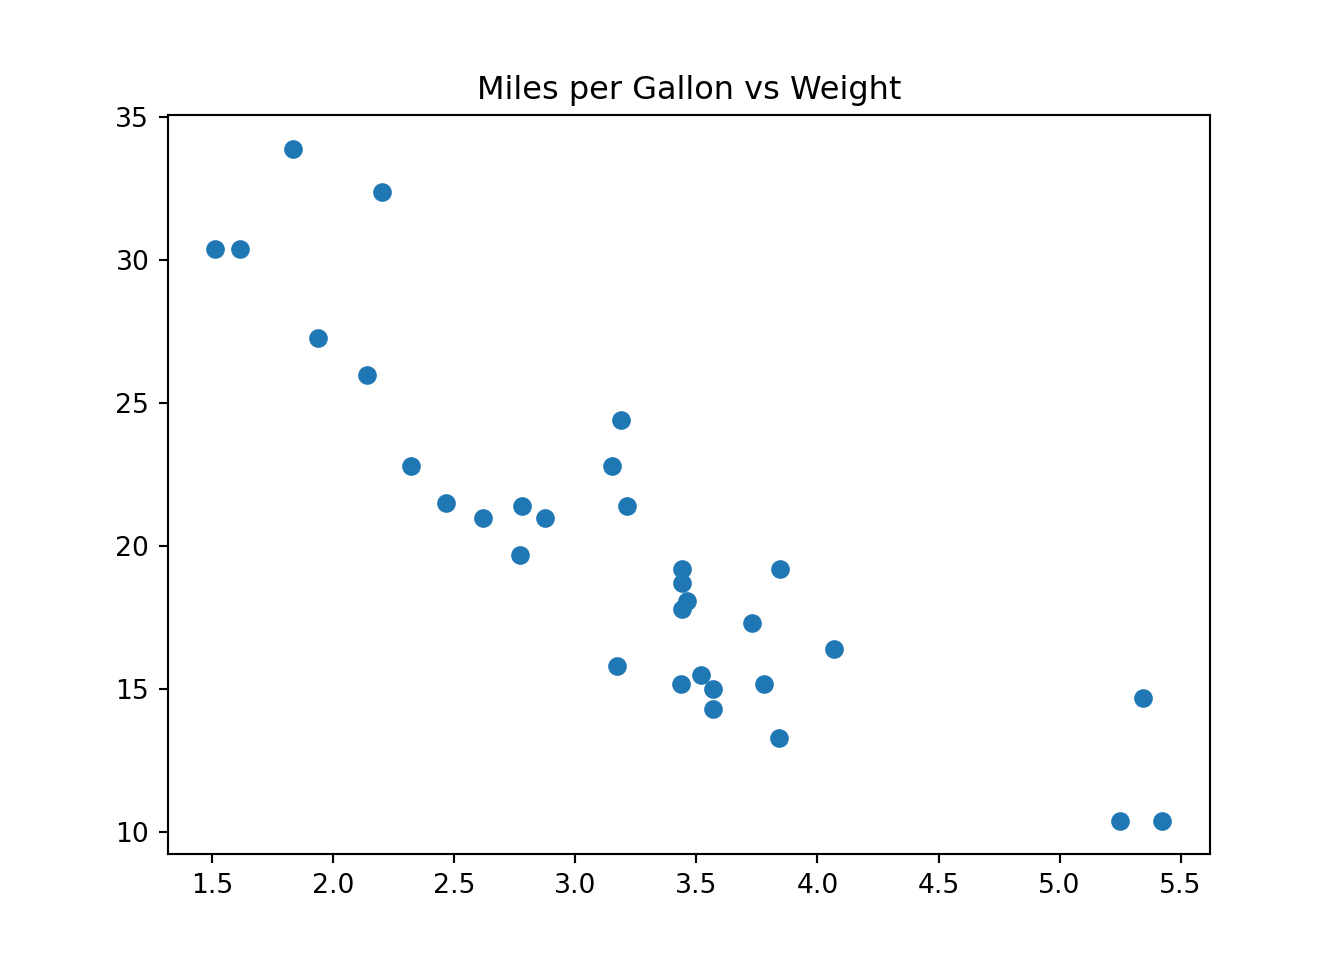
To see a page created from a native Jupyter Notebook, see here!
We can even run JavaScript and add interactivity:
data = d3.csv("https://raw.githubusercontent.com/plotly/datasets/master/mtcars.csv")

Plot.plot({
  subtitle: "Miles per Gallon vs Weight",
  height: 300,
  x: {domain: [1,5]},
  y: {domain: [10,35]},
  marks: [
    Plot.ruleX([1]),
    Plot.ruleY([10]),
    Plot.dot(data, {x: "wt", y: "mpg", channels: {name: "manufacturer"}, tip: true})
  ]
});